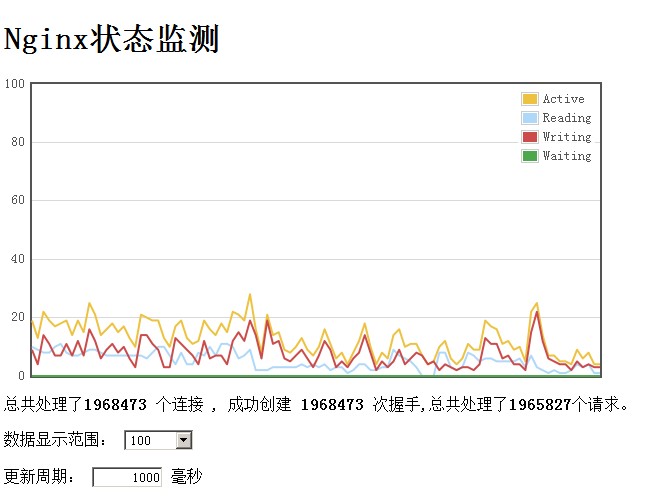
Nginx状态监测心跳图显示统计html 代码:
<!DOCTYPE HTML PUBLIC "-//W3C//DTD HTML 4.01 Transitional//EN" "http://www.w3.org/TR/html4/loose.dtd">
<html>
 <head>
    <meta http-equiv="Content-Type" content="text/html; charset=utf-8">
    <title>Nginx状态监测</title>
    <link href="layout.css" rel="stylesheet" type="text/css">
    <!--[if lte IE 8]><script language="javascript" type="text/javascript" src="../excanvas.min.js"></script><![endif]-->
    <script language="javascript" type="text/javascript" src="./jquery.min.js"></script>
    <script language="javascript" type="text/javascript" src="./jquery.flot.min.js"></script>
 </head>
    <body>
    <h1>Nginx状态监测</h1>

    <div id="placeholder" style="width:600px;height:300px;"></div>

    <p>总共处理了<strong><span class="handled1"></span> </strong>个连接 , 成功创建<strong> <span class="handled2"></span> </strong>次握手,总共处理了<strong><span class="handled3"></span></strong>个请求。</p>
	<p>数据显示范围:
	  <select id="updateMax"><option value="100">100</option>
    <option value="500">500</option>
    <option value="1000">1000</option>
    <option value="2000">2000</option>
    <option value="5000">5000</option>
    <option value="10000">10000</option>
    <option value="20000">20000</option>
    <option value="50000">50000</option>
    <option value="100000">100000</option>
    </select></p>
    <p>更新周期:
      <input id="updateInterval" type="text" value="" style="text-align: right; width:5em">
      毫秒
    </p>
<pre>解析:<br> Active connections    //当前 Nginx 正处理的活动连接数。<br> server accepts handledrequests //总共处理了 N 个连接 , 成功创建  N 次握手,总共处理了  N 个请求。<br> Reading //nginx 读取到客户端的 Header 信息数。<br> Writing //nginx 返回给客户端的 Header 信息数。<br> Waiting //开启 keep-alive 的情况下,这个值等于 active – (reading + writing),意思就是 Nginx 已经处理完正在等候下一次请求指令的驻留连接

技术支持:QQ583964941</pre>
 <script type="text/javascript">
$(function () {
    // we use an inline data source in the example, usually data would
    // be fetched from a server
    var data = {"Active":[],'handled':[],'Reading':[],'Writing':[],'Waiting':[]}, totalPoints = 100;
	function getAjaxData(d,key){
		d=d[key];
		if (data[key].length > 0)
            data[key] = data[key].slice(1);

		while (data[key].length < totalPoints) {
			 data[key].push(0);
		}
		data[key][data[key].length-1] = parseInt(d);

		var res = [];
        for (var i = 0; i < data[key].length; ++i)
            res.push([i, data[key][i]])

        return {label: key,data:res};
	}
    function getRandomData() {
		//return getAjaxData();
        if (data.length > 0)
            data = data.slice(1);

        // do a random walk
        while (data.length < totalPoints) {
            var prev = data.length > 0 ? data[data.length - 1] : 50;
            var y = prev + Math.random() * 10 - 5;
            if (y < 0)
                y = 0;
            if (y > 100)
                y = 100;
            data.push(y);
        }

        // zip the generated y values with the x values
        var res = [];
        for (var i = 0; i < data.length; ++i)
            res.push([i, data[i]])

        return res;
    }

    // setup control widget
    var updateInterval = 1000;
	var updateMax = 100;

    $("#updateInterval").val(updateInterval).change(function () {
        var v = $(this).val();
        if (v && !isNaN(+v)) {
            updateInterval = +v;
            if (updateInterval < 1)
                updateInterval = 1;
            if (updateInterval > 2000)
                updateInterval = 2000;
            $(this).val("" + updateInterval);
        }
    });
$("#updateMax").val(updateMax).change(function () {
        var v = $(this).val();

        if (v && !isNaN(+v)) {
            updateMax = +v;
            $(this).val("" + updateMax);
			init(updateMax);
        }
    });
    // setup plot

	function init(updateMax){
  var options = {
			series: { shadowSize: 0 }, // drawing is faster without shadows
			yaxis: { min: 0, max: updateMax },
			xaxis: { show: false }
		};

		$.getJSON('nginx_status.php',function(d,s){
			$('.handled1').text(d['handled'][0]);
			$('.handled2').text(d['handled'][1]);
			$('.handled3').text(d['handled'][2]);
			plot = $.plot($("#placeholder"), [getAjaxData(d,"Active"),getAjaxData(d,'Reading'),getAjaxData(d,'Writing'),getAjaxData(d,'Waiting') ], options);
			T1 =  setTimeout(update, updateInterval);
		});
	}
    function update() {
		$.getJSON('nginx_status.php',function(d,s){
			clearTimeout(T1);

			$('.handled1').text(d['handled'][0]);
			$('.handled2').text(d['handled'][1]);
			$('.handled3').text(d['handled'][2]);
				plot.setData([getAjaxData(d,"Active"),getAjaxData(d,'Reading'),getAjaxData(d,'Writing'),getAjaxData(d,'Waiting') ]);
				// since the axes don't change, we don't need to call plot.setupGrid()
				plot.draw();
		    T1 =  setTimeout(update, updateInterval);
		});

    }
	init(100);

});
 </script>
 </body>
</html>
nginx_status.php 代码:
<?php
$url ='http://www.nginx.com/status';//要监控的NGINX状态页
$c = file($url);
//print_r($c);

list(,$Active) = explode(':',$c[0]);

$handled = explode(' ',trim($c[2]));

$c[3] = str_replace(array('Reading:','Writing:','Waiting:'),array('','|','|'),$c[3]);
$rww = explode('|',$c[3]);
$array = array(
	'Active'=>intval($Active),
	'handled'=>$handled,
	'Reading'=>intval($rww[0]),
	'Writing'=>intval($rww[1]),
	'Waiting'=>intval($rww[2]),
);

        header('Content-Type:application/json');
echo json_encode($array);
/*
Active connections: 32
server accepts handled requests
 577705 577705 576800
Reading: 17 Writing: 15 Waiting: 0

*/
?>
显示效果:
开启nginx 状态监控: http://www.cnblogs.com/amityat/archive/2011/08/23/2150158.html
jquery 下载: http://jquery.com/download/
jquery图表 类库下载: http://code.google.com/p/flot/
声明: 本文由( admin )原创编译,转载请保留链接: Nginx状态监测心跳图显示统计
Nginx状态监测心跳图显示统计:等您坐沙发呢!
发表评论
------====== 本站公告 ======------
联系信息:
电话:19970108113(微信同号) QQ:3142401606
支付宝:https://me.alipay.com/lxq73061
相关插件程序等信息均会在站内发布,敬请关注。

